* See UPDATES below...
The following ZeroHedge article, pertaining to Saxo Bank's 10 Outrageous Predictions For 2023, is interesting.
My analysis will focus on on their prediction of Gold (GC) at 3,000 in 2023.
Technically, a target zone of between 2,990.94 and 3,049.12 exists.
It is formed by a long-term External 2.236% Fibonacci level at 2,990.94 and a long-term 1.382% Fibonacci Extension level at 3,049.12, as shown on the following monthly chart of GC.
As I'm writing this on Tuesday, the current price is 1,783.15. That's shy of 1,216.85 points yet to be gained by the end of 2023 (a gain of 68%)...or approximately 100 points per month.
So, while that would be an unprecedented move for Gold in one year, 3,000 is within the Fibonacci target price zone...and is technically possible.
I'll leave the odds of that happening to the market makers. 👀
On a shorter-term timeframe, keep an eye on the following daily GOLD:GVZ ratio chart (Gold versus Volatility).
In general, look for:
- a bullish Golden Cross to re-form on the 50/200 MAs,
- the RSI to remain above the 50.00 level,
- the MACD and PMO indicators to remain above Zero, and
- the price to hold above 100.00, then break and hold above the 120.00, 130.00, and 160.00 resistance levels, respectively,
And then...there's this little nugget hiding in the shadows...ready to create havoc in financial markets...
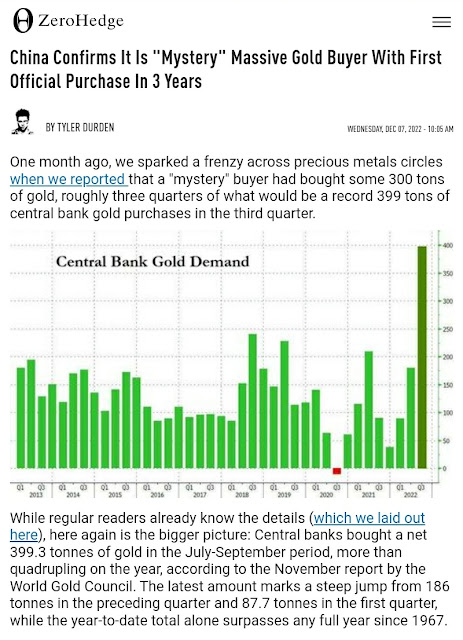
Central Banks increased their puchases of Gold...
It seems that one of the reasons behind the gold-buying spree is that this precious metal, supposedly, represents an alternative to the strong US Dollar in purchasing power, especially in the face of high inflation and a looming global recession...
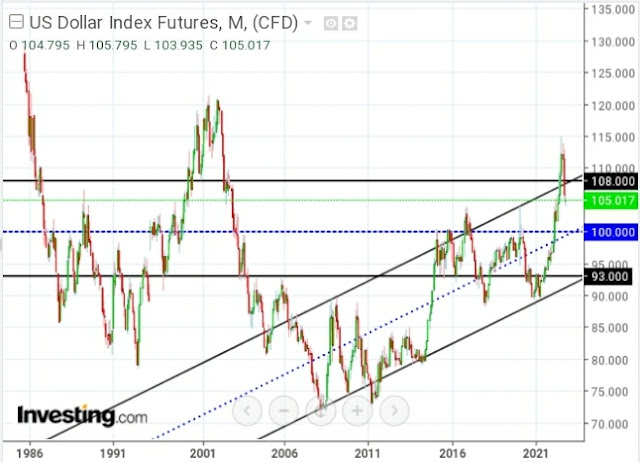
For now, the US Dollar (DX) may be headed back to the rising channel's 'mean' and long-term price support at 100, as shown on the following monthly chart.
The channel's 'zone of resistance and support' is currently between 108 and 93.
A rally and hold above 108 may rapidly decelerate the pace of gold-buying, whereas a hold above 93 may simply spur its acquisition. I expect that the Dollar will bounce around within that zone for awhile...two price levels to watch in the coming weeks and months.
So...$3,000 Gold in 2023?...
😏
* UPDATE March 13, 2025...
Two years and three months later, GOLD finally hit 3,000...a gain of 68% since this target was floated as a possibility (for 2023).
So, not only was it possible, except for the timing, it was technically probable, given my Fibonacci analysis, etc., as detailed above.


