* See UPDATES below...
The following monthly charts show the extreme moves (plunges and spikes) and volatility experienced this year in the 10-Year T-Note (TYZ2), the 10-Year Treasury Yield (US10YT), and the MOVE Index (MOVE) (which measures Treasury rate volatility through options pricing).
They are all trading near a critical support or resistance level, shown in pink.
If the MOVE Index blows through 160.00, we may see TYZ2 drop to 100.00, or lower, and US10YT spike up to 5.00, or higher...so, keep an eye on that one.


The following tweets are from the weekend...so what's going on in the bond market?


More interesting tweets...serious problems abound, and President Biden seems oblivious to all of them...


* UPDATE Oct. 23...
An interesting take on US Bonds...

2-Yr, 5-Yr, 10-Yr & 30-Yr US Bonds have begun to rally, as shown on the following 20-day 60-min. intraday chartgrid...but, it's too early to tell if they have bottomed.

* UPDATE Oct. 31...
Oops!...🤔
Keep an eye on (Nov. 2) interest rates and "Fed-speak!"


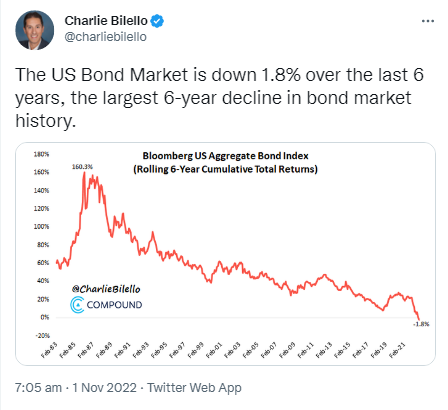
* UPDATE Nov. 1...
+160.3% at its peak in 1987...to -1.8% now.
I repeat...what's going on in the bond market? 😲