The following pivot point calculations and chart are provided to illustrate a variety of support and resistance levels/price targets on the monthly timeframe for the S&P 500 Index (SPX).
The calculations below are based on the high/low/close of January's candle for February's pivot point levels/price targets.
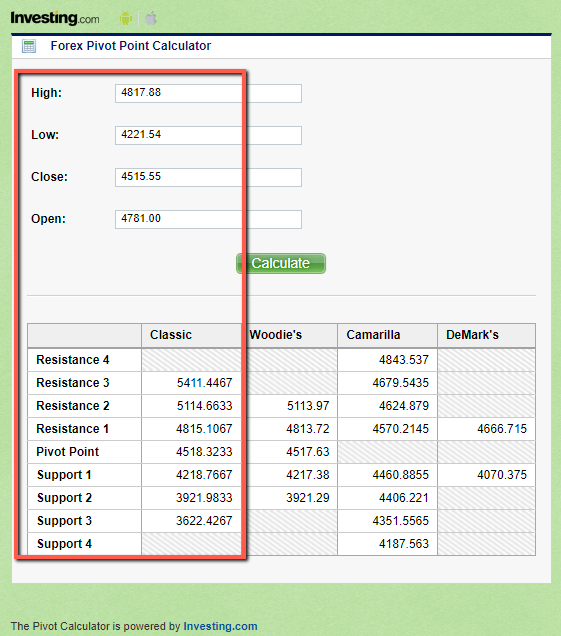
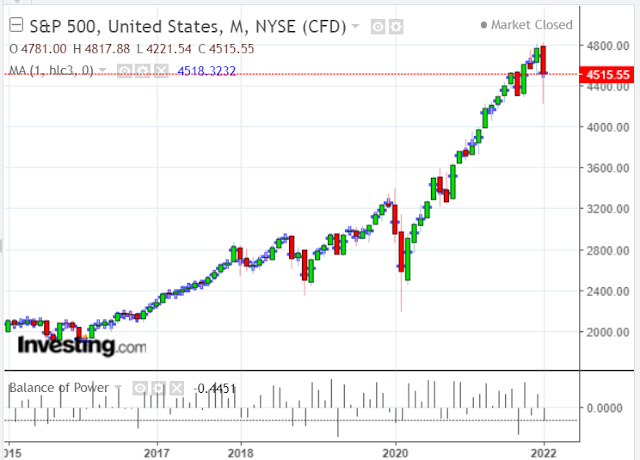
The following monthly chart shows that January's candle closed just below the Pivot Point for February (noted above at 4518.3233) [depicted as the horizontal blue moving average...1-month MA (h/l/c/)].
Similarly, the February R1 and S1 pivot point levels/price targets are very near January's high and low.
So, we may see either, or both, of those levels re-tested before a new monthly trend is created and, subsequently, confirmed in the coming months.
At the moment, the Balance of Power has flipped from buyers to sellers on this timeframe. Keep an eye on this indicator for clues on future monthly price action, market sentiment and trend confirmation.