WELCOME
Dots
PARIS CAFE

ECONOMIC EVENTS
UPCOMING (MAJOR) U.S. ECONOMIC EVENTS...
*** CLICK HERE for link to Economic Calendars for all upcoming events.
Saturday, December 24, 2022
Friday, December 23, 2022
2022 Market Wrap-Up: 'Like Watching Paint Dry'
As shown on the following monthly chart, the price has, essentially, traded sideways in a large trading zone, between 3500 and 4300.
It's bounced back and forth between Buyers and Sellers, like a yo-yo.
As it's turned out, any gains, either on the long or the short side, have been short-lived...much like the first half of 2022 was.
Day-to-day or week-to-week trading for 2022 has been erratic and non-directional...and about as interesting as 'watching paint dry.'
Unless you took profits during the December 2021 candle -- which followed November's bearish 'shooting star' (which wasn't confirmed until January's 'bearish engulfing' candle) -- and, either, shorted the markets and held, or, simply stayed out, you were caught up in this slow slip downwards, dominated by choppy large-scale sideways consolidations.
As I mentioned in my post of December 21, we may see a fourth 'candy cane' form in January 2023, with a price target of 3200...if Sellers remain in control.
We'll see what happens.
I hope to post my Annual Forecast for the New Year in the next few days, so stay tuned. As a reminder, my 2021 Market Wrap-Up & 2022 Forecast can be read here.
Thursday, December 22, 2022
Wednesday, December 21, 2022
SPX: A 4th Candy Cane For 2023?
Will we see a fourth 'candy cane' form on the SPX in January?
If so, the target is 3200, as shown on the following weekly chart.
Friday, December 16, 2022
Thursday, December 15, 2022
Saturday, December 10, 2022
Friday, December 09, 2022
LULULEMON: Caution...Bearish Head & Shoulders Forming
Lululemon's (LULU) unsold inventory is piled up to the rafters!
With a likely recession looming in 2023, this does not bode well for their stock.
The following monthly chart of LULU is signalling further volatility and weakness ahead, with the potential formation of a bearish Head & Shoulders pattern, as well as the Balance of Power flipping to the Sellers.
A drop and hold below the neckline at 245.00 could prove to be catastrophic and see a plummet to its H&S target at 50.00.
The Retail ETF (XRT) is already weak, and the Sellers are in charge, once again, as shown on the following monthly chart.
Major support sits much lower than its current price, at 50.00. A drop and hold below could see price plunge to 40.00, or even lower to 20.00.
Tuesday, December 06, 2022
Saxo's 10 Outrageous Predictions For 2023: Is $3,000 Gold Possible?
* See UPDATES below...
The following ZeroHedge article, pertaining to Saxo Bank's 10 Outrageous Predictions For 2023, is interesting.
My analysis will focus on on their prediction of Gold (GC) at 3,000 in 2023.
Technically, a target zone of between 2,990.94 and 3,049.12 exists.
It is formed by a long-term External 2.236% Fibonacci level at 2,990.94 and a long-term 1.382% Fibonacci Extension level at 3,049.12, as shown on the following monthly chart of GC.
As I'm writing this on Tuesday, the current price is 1,783.15. That's shy of 1,216.85 points yet to be gained by the end of 2023 (a gain of 68%)...or approximately 100 points per month.
So, while that would be an unprecedented move for Gold in one year, 3,000 is within the Fibonacci target price zone...and is technically possible.
I'll leave the odds of that happening to the market makers. 👀
On a shorter-term timeframe, keep an eye on the following daily GOLD:GVZ ratio chart (Gold versus Volatility).
In general, look for:
- a bullish Golden Cross to re-form on the 50/200 MAs,
- the RSI to remain above the 50.00 level,
- the MACD and PMO indicators to remain above Zero, and
- the price to hold above 100.00, then break and hold above the 120.00, 130.00, and 160.00 resistance levels, respectively,
And then...there's this little nugget hiding in the shadows...ready to create havoc in financial markets...
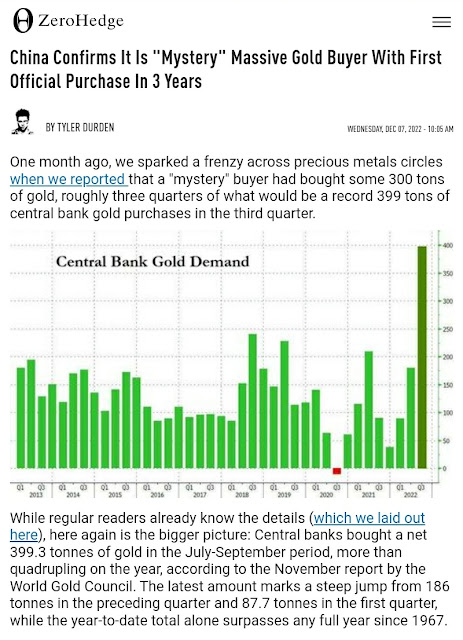
Central Banks increased their puchases of Gold...
It seems that one of the reasons behind the gold-buying spree is that this precious metal, supposedly, represents an alternative to the strong US Dollar in purchasing power, especially in the face of high inflation and a looming global recession...
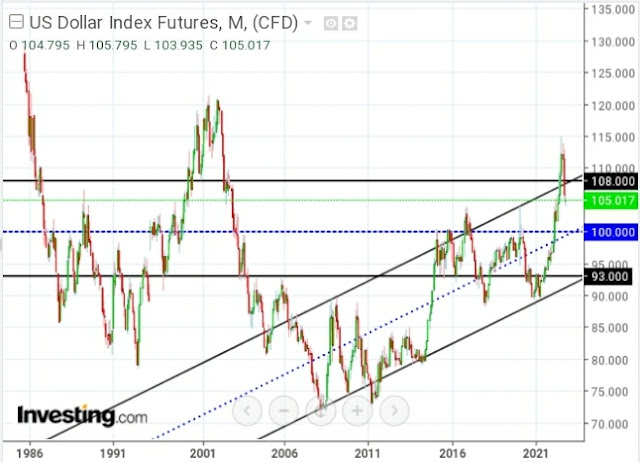
For now, the US Dollar (DX) may be headed back to the rising channel's 'mean' and long-term price support at 100, as shown on the following monthly chart.
The channel's 'zone of resistance and support' is currently between 108 and 93.
A rally and hold above 108 may rapidly decelerate the pace of gold-buying, whereas a hold above 93 may simply spur its acquisition. I expect that the Dollar will bounce around within that zone for awhile...two price levels to watch in the coming weeks and months.
So...$3,000 Gold in 2023?...
😏
* UPDATE March 13, 2025...
Two years and three months later, GOLD finally hit 3,000...a gain of 68% since this target was floated as a possibility (for 2023).
So, not only was it possible, except for the timing, it was technically probable, given my Fibonacci analysis, etc., as detailed above.
Saturday, December 03, 2022
Twitter's Suppression Of Free Speech Exposed
* See UPDATES below...
As promised by Twitter's new private owner, Elon Musk, he's making public the massive suppression of free speech actions taken by former Twitter executives and employees on its social media platform in coordination, primarily, with Democrats and Joe Biden's presidential campaign staff.
For background, I've written extensively on Joe Biden here, here, here, and here.
The following tweets lay out Twitter's actions taken in the days leading up to the 2020 Presidential election...where information (first reported by Miranda Devine in the New York Post) was suppressed on its platform in connection with Hunter Biden's laptop.
Much more will be released over the coming days...THEY ARE EXPLOSIVE!
THE TWITTER FILES:
THE TWITTER FILES: Part One...
Friday, December 02, 2022
Thursday, December 01, 2022
Williams Alligator Is Forecasting Further Weakness for Blackstone Group Ltd. (BX)
The Williams Alligator indicator is hinting at further weakness for the Blackstone Group Ltd. (BX), on the longer-term monthly timeframe, as shown on the following chart.
A drop and hold below 80.00 could see price plunge to its next major support level of 60.00, or lower to 40.00.
Today's revelations contained in the following reports may prove to be the catalyst for the continuation, or even an acceleration, of such a bearish scenario.
Perhaps the following provides a partial explanation for their stock's weakness...ESG investing...


