On Friday, the VIX hit an 'extreme high' of 54.39 before retreating to close at a 'frothy high' of 41.94.
Activity above 30.00 ('frothy') is unusual and has been, historically, short-lived, except during and in the aftermath of the global 2008/09 financial crisis.
The question is, is the 'extreme high' volatility of February and the first week of March going to be short-lived, or is it forecasting a longer-lasting period of equity weakness, perhaps into the summer, or even for the rest of the year?
The following two daily SPX:VIX ratio charts show that price fell below an extreme low of 60.00, before closing at 70.87 on Friday.
For possible clues on SPX direction in the near term (and from quarter to quarter for the remainder of the year), here's what I'll be monitoring:
- the ratio moving averages are about to form another bearish moving average Death Cross...if that holds, look for more volatility and equity weakness
- if the ratio drops and holds below 60.00, we should see a sharp and deep drop on the SPX
- if the ratio bounces to anywhere between 80.00 and 100.00, we'll likely see further wild swings in both directions on the SPX
- if the ratio manages to recapture and hold above 100.00, then we'll likely see the SPX consolidate or move higher on lower volatility...in that scenario, watch for a bullish Golden Cross to form and hold on the moving averages to confirm further equity strength...also, watch for bullish crossovers to form and hold on the MACD and PMO, and for the RSI to retake and hold above 50.00
- I recently identified major support and resistance levels for the S&P 500 E-mini Futures Index (ES) in this post, and I'd say they're relevant for the remainder of 2020 (N.B. the 2-yr daily chart below is from that post and, as such, its closing price is that of February 28)
The following year-to-date percentages gained/lost graph shows the general rotation of money out of equities and into bonds this year, as well as the extreme level of volatility.
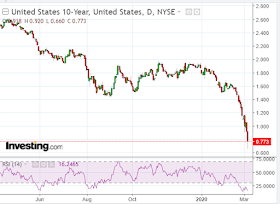
On March 3, the U.S. Federal Reserve cut rates as the US10YT was plunging below 1.00. It has continued to drop and closed at 0.773 on Friday, after making a new 60-year low of 0.660, as shown on the daily chart below.
Further bond strength and falling bond yields do not bode well for sustainable strength in U.S. equities.
So, watch for any kind of turnaround to occur and hold in bonds before conviction in equity strength resumes, in addition to the items I've identified above.
Whether such a sustainable scenario requires emergency assistance in the form of further monetary stimulus from the Fed and/or fiscal stimulus measures from the government remains to be seen.
In the meantime, buckle up!


