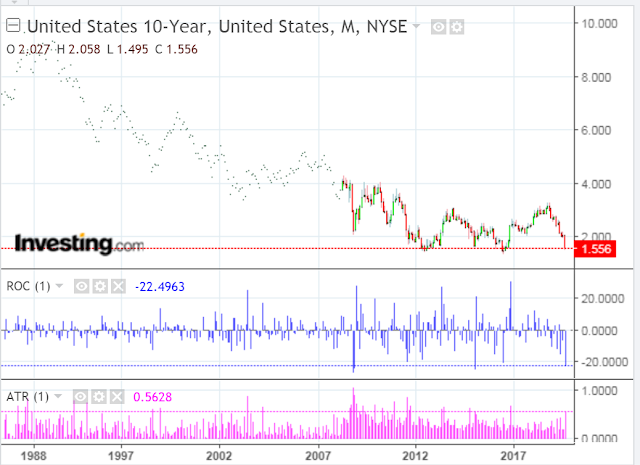
Once again, US 10-Year Treasury yields are approaching 60-year historical lows set in mid-2012 and mid-2016, as shown on the following monthly chart.
Shown on the next shorter-term monthly chart are the Rate-of-Change (ROC) and Average True Range (ATR) indicators (in histogram format and with an input value of one period).
Should this rate continue to fall, and, in particular, if it breaks and holds below the previous lows, I'd say that US equity markets would weaken considerably. In that regard, watch for accelerating larger spikes on both histograms for confirmation of further yield drops. Otherwise, watch for large sustained spikes to confirm a serious turnaround to the upside...with US equities strengthening.
* UPDATED August 18...
This Zero Hedge article outlines why negative rates do not bode well for world economies, markets and more...
 |
| Source: ZeroHedge.com |
In this regard, the following daily chart of the MSCI World (ex USA) Index shows that price has dropped, once again, to just above the 1800 level.
The MACD histogram and RSI indicators are hinting that price is attempting to stabilize on this short-term timeframe and may reverse its decline that began in early July.
The following monthly chart of the MSCI World, Global (incl USA) Indexes shows that price is stuck at a triple-top formation, after failing to break out and hold above an all-time high set in January 2018.
The RSI, MOM and ROC indicators have yet to make a new swing high above those also set in January 2018.
In summary, keep an eye on both of these indices and short and longer term timeframes, along with their indicators, as well as US 10-Year Treasury yields and ROC and ATR indicators, for clues that world markets may, finally, be paying attention to negative effects of negative bond yields.


