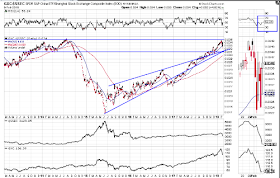
The following daily ratio charts show the performance of three Financial ETFs with their respective country/union's Major Index, namely, XLF:SPX, EUFN:STOX50, and GXC:SSEC.
Each of them has weakened compared with their counterpart index during the volatility spike that occurred in world markets over the past couple of weeks. These ratios had either reached or broken above some sort of resistance level and are now above near-term support.
If we see the RSI decline below the 50.00 level, this could be a warning signal that their indices may weaken more than is currently anticipated.
The following monthly charts of XLF, EUFN, GXC, WFC, GS & DB all show that they had reached major resistance (either price or trendline) and have pulled back. Their respective support levels are shown, along with the momentum indicator.
With the exception of GXC, momentum on all of them had, either stalled, or had been declining on their latest price ascent...hinting of impending weakness. Momentum on EUFN and WFC is close to breaking below zero, and is below zero on DB. A drop and hold below zero on this timeframe could see an acceleration in selling in these instruments, as well as major world indices, in this current high-volatility environment.
Finally, of interest is the trading range of February's candle on the following monthly (percentage) chart of the VIX.
As of last Friday's close, we're only seven trading days into February and already this month's candle range is larger than those of previous spikes (with the exception of those that began in October 2008 prior to the financial crisis), and its percentage-gained has exploded in those seven days. As well, momentum is rapidly rising on this timeframe. I think that this is signalling that the selling in the SPX has not yet finished.
So, keep an eye on the financial instruments mentioned above for clues on equity weakness.


