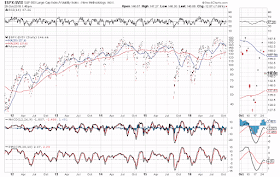
Background information on the SPX:VIX ratio can be found here. Equity volatility will elevate as long as this ratio remains below the 150 level (as of 1:45 pm ET today it has fallen below, once again, as shown on the following Monthly chart).
BUT, watch for a potential bear trap, inasmuch as price action and all three technical indicators have morphed into triangular patterns and are nearing their respective apex in readiness for a major breakout, one way or the other, as shown on the Daily chart below.
With the U.S. Presidential election only two weeks away, I doubt whether the aggressively-bullish scenario, that I painted as a possibility in my post of July 1st, is realistic. However, we may see the SPX surge toward that 2280 level, so I'd keep an eye on this ratio to see if price can break and hold back above 150, whether the RSI climbs back and holds above 50, and whether the MACD and PMO re-cross and hold to the upside, as confirmation of such bullish aggression.

