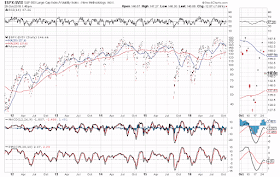
With 10 days left before U.S. voters cast their ballots for the next President, we've just learned from a variety of news agencies that FBI Director James Comey has reopened their investigation into Hillary Clinton's handling of sensitive government information due to "the existence of emails that appear to be pertinent to the investigation."
Price on the SPX immediately dropped on this revelation. This is reflected in the drop shown on the SPX:VIX ratio chart below (as of 1:50 pm ET today)...price is now below the 200 MA, and the 3 technical indicators are displaying new "SELL" signals.
We'll see whether this new investigation trumps what I mentioned in my last post and becomes the "October surprise" that has been rumoured to surface in the media for months, or whether it's just a short-term distraction designed to trap market bears.
Either way, volatility will remain elevated as long as price on this ratio stays below the 150 level.
Pages
▼
Friday, October 28, 2016
Wednesday, October 26, 2016
Equity Bear Trap Looming?
Background information on the SPX:VIX ratio can be found here. Equity volatility will elevate as long as this ratio remains below the 150 level (as of 1:45 pm ET today it has fallen below, once again, as shown on the following Monthly chart).
BUT, watch for a potential bear trap, inasmuch as price action and all three technical indicators have morphed into triangular patterns and are nearing their respective apex in readiness for a major breakout, one way or the other, as shown on the Daily chart below.
With the U.S. Presidential election only two weeks away, I doubt whether the aggressively-bullish scenario, that I painted as a possibility in my post of July 1st, is realistic. However, we may see the SPX surge toward that 2280 level, so I'd keep an eye on this ratio to see if price can break and hold back above 150, whether the RSI climbs back and holds above 50, and whether the MACD and PMO re-cross and hold to the upside, as confirmation of such bullish aggression.
Monday, October 10, 2016
VIX Volatility Defies Today's Spike in SPX
As of 12:50 pm EDT today, the SPX:VIX ratio pair is not on board with today's spike in the SPX, as shown on the following Daily ratio chart...instead, watch for weakness ahead on the SPX.
Tuesday, October 04, 2016
The Highs & Lows of the United Kingdom
We've never seen a wider spread between the FTSE 100 Index (it hit all-time highs today) and the British Pound vs U.S. Dollar forex pair (now at new 30-year lows), as shown on the following Monthly charts...presumably the after-effects of the "Brexit" vote.
The question is, is this the new normal and what will that mean for inflation in the UK if it is?
The question is, is this the new normal and what will that mean for inflation in the UK if it is?


