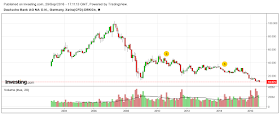
From an all-time high of 103.14 in May of 2007 to an all-time low of 10.19 (and close at 10.875) today (Thursday), Germany's biggest bank continues its sink into the abyss, as shown on the Monthly chart of Deutsche Bank.
The 3 technical indicators shown on the following Daily chart are no longer supporting a slowdown of its downtrend (as I had reported in my post of February 8th)...rather, they are now suggesting a resumption and acceleration of a stock dump.
This bank stock is now sitting at a tiny fraction of its former value...systemic-risk or value stock? A picture is worth a thousand words...
P.S.
Even more stunning, is the meteoric drop in value (from its June 2007 high of 228.96 to today's close of 5.80) for Germany's second-largest bank, Commerzbank, as shown on the Monthly chart below.
All three technical indicators on its Daily chart below also show evidence of renewed and accelerating selling pressure...reflecting great weakness in Germany's banking sector, despite all of the ECB's various monetary stimulus attempts made, to date, to prop up Europe's financial woes from the onslaught of the 2007/08 financial crisis/recession.


