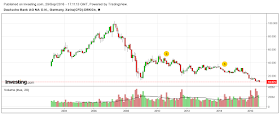
From an all-time high of 103.14 in May of 2007 to an all-time low of 10.19 (and close at 10.875) today (Thursday), Germany's biggest bank continues its sink into the abyss, as shown on the Monthly chart of Deutsche Bank.
The 3 technical indicators shown on the following Daily chart are no longer supporting a slowdown of its downtrend (as I had reported in my post of February 8th)...rather, they are now suggesting a resumption and acceleration of a stock dump.
This bank stock is now sitting at a tiny fraction of its former value...systemic-risk or value stock? A picture is worth a thousand words...
P.S.
Even more stunning, is the meteoric drop in value (from its June 2007 high of 228.96 to today's close of 5.80) for Germany's second-largest bank, Commerzbank, as shown on the Monthly chart below.
All three technical indicators on its Daily chart below also show evidence of renewed and accelerating selling pressure...reflecting great weakness in Germany's banking sector, despite all of the ECB's various monetary stimulus attempts made, to date, to prop up Europe's financial woes from the onslaught of the 2007/08 financial crisis/recession.
Pages
▼
Thursday, September 29, 2016
Tuesday, September 27, 2016
World Market Index Hovers at Make-or-Break Level
All three indicators on this 5-Year Daily chart of the World Market Index are slightly above their respective zero levels, with price hovering above the 50 moving average. They'll all need to hold at or above those levels, otherwise a sharp failure would likely spell big problems for U.S. equities.
Friday, September 09, 2016
Volatility Back Into "Major Conflict Zone"
After today's (Friday's) 53.5 point drop on the SPX, volatility has now fallen back into the "Major Conflict Zone," as depicted on the following 20-Year Monthly ratio chart of SPX:VIX.
As I mentioned here and here, a drop and hold below the 150 Bull/Bear line-in-the-sand level would see a retest of the June 27th lows. You can see from the 60-Day 60-Minute ratio chart below, price closed today at 121.5. There are two remaining gaps below that level yet to be filled, which, when filled, would realize that retest.
Each candle on the following ratio chart depicts One Year. You can see clearly that today's close sits just above the 116.61 open of the 2007 candle.
Each candle on the following ratio chart depicts One-Quarter of One Year. As of today's closing level, upward Momentum is lower now than it was at the open of the Q1 2007 candle...hinting that the buying and bullishness seen on the SPX this year (which pushed Momentum to an all-time parabolic level on the Monthly ratio chart), is, in fact, weak, unsustainable, and without serious merit.
CONCLUSIONS:
Volatility has now risen sharply, after a summer of complacency. Look for wild swings in both directions on these ratio charts as long as price remains below 150. And, if it drops below 80.00, after a retest of the June 27th lows, I'd say that equity markets are in serious trouble and in for a substantial drop.


