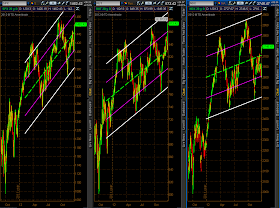
With today's (Wednesday's) "gap-up-and-go" action on the SPX, RUT, and NDX, volatility got crushed, as shown on the three Daily ratio charts below.
The SPX:VIX ratio closed just above trendline resistance. I'd say, if price can hold above 95.00, it has a good chance of going higher, provided the Momentum indicator stays above the zero level now.
The RUT:RVX ratio closed at major resistance. I'd say, if price can hold above 46.00, it has a good chance of going higher, provided the Momentum indicator stays above the zero level now.
The NDX:VXN ratio closed in between trendline resistance and support. I'd say, if price can hold above 150.00, it has a good chance of going higher, provided the Momentum indicator stays above the zero level now.
As shown on the Daily charts below, and looking at a bigger picture, there is still plenty of room in a larger channel from the June 2012 lows on the SPX and NDX before they hit their upper channel, while the upper channel is much closer at around 890.00 on the RUT. Whether the RUT hits its upper channel and continues to run higher without either consolidating or pulling back remains to be seen, if the SPX and NDX continue their rally...one to watch for continued leadership, particularly after making it's all-time high/closing high today.


