The first three chartgrids show a Monthly, Weekly, and Daily timeframe for the 6 Major Indices.
- In the longer term (Monthly), price is sitting in the "Bull Zone" for all 6 Indices.
- In the medium term (Weekly), price is still in the "Bull Zone" for 5 of the Major Indices, with only the Dow Utilities Index now in the "Bear Zone."
- In the short term (Daily), price closed in the "Bull Zone" for 5 of the Major Indices, with only the Dow Utilities Index remaining in the "Bear Zone." The one to watch for either further developing weakness or a strengthening is the Dow Utilities Index.
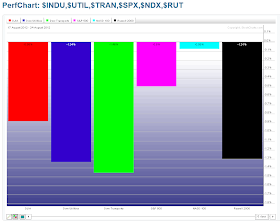
The graph below depicts percentage gained/lost for the past week for the Major Indices. Profits were taken in all 6 Indices (with the least taken in the Nasdaq 100 Index), as some of them met with resistance at the upper BB. The Nadsaq 100 Index is worth keeping an eye on to see if it can maintain its bullish lead.
The next three chartgrids show a Monthly, Weekly, and Daily timeframe for the 9 Major Sectors.
- In the longer term (Monthly), price is sitting in the "Bull Zone" for XLY, XLK, XLI, XLE (just), XLP, XLV, XLU, and XLF (just). Price on the XLB is just in the "Bear Zone."
- In the medium term (Weekly), price is still in the "Bull Zone" for all 9 Major Sectors (XLU is just inside this zone).
- In the short term (Daily), price closed in the "Bull Zone" for XLY, XLK, XLI, XLB (just), XLE, XLV, and XLF. Price closed in the "Bear Zone" for XLP (just) and XLU.
The graph below depicts percentage gained/lost for the past week for the Major Sectors. Profits were taken in 7 Sectors, as some of them met with resistance at the upper BB, while XLF remained flat, and XLV gained on the week.
In summary, and in the coming week(s), it will be important to monitor price action on all 6 Major Indices and 9 Major Sectors on all 3 timeframes around the middle BB to try to gauge whether buying pressure continues to surface at this point, or whether more bearish selling begins to appear. Furthermore, we'll see whether buying overcomes the resistance of the upper BB on any retests at this level, firstly, on the Daily timeframe (to gauge the strength of their support levels from where they bounced on Friday). Otherwise, I'd look for a retest of this near-term support, and possibly lower support levels (e.g. the lower BB on the Daily timeframe, or the middle or lower BB on the Weekly and Monthly timeframes).
Before I conclude this post, I'll also take a look at where volatility ended on Friday for the S&P 500 Index and the Russell 2000 Index. The two Daily ratio charts below of SPX:VIX and RUT:RVX show that price pulled back after running into major resistance, but both bounced on Friday at their respective near-term support levels...two to watch to see if volatility reappears in coming days/weeks. (Please refer to my last weekly market update and to my post of August 15th to get a longer-term perspective on these charts.)
Enjoy your weekend and best of luck next week!


