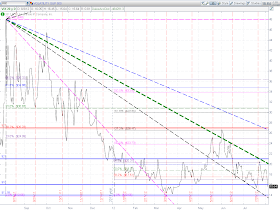
I like to look at this type of format when I get confusing signals from short-term, day-to-day choppy, whippy, and volatile price action in tight ranges. My conclusions will be based on the daily closes, rather than on candle highs, lows, and closes.
All of them, with the exception of the Dow Transports and Russell 2000 Indices, have been trending higher on their closes since their June closing lows in a fairly tight channel. However, even the Transports and Russell are still above their June lows All of them, except the Energy Sector, are above their January closing lows...the Materials Sector and Dow Transports Index are only just above their January lows. This tells me that the June closing lows are very important and could mark the bull/bear "Line-in-the-Sand" level for 2012 for each of these Indices and Sectors, and it may have marked the beginning of a rally that could last until the end of this year. I am, however, mindful of the headwinds that face the markets, as mentioned in my last weekly update, as well as my posts of July 31st and August 2nd...these could very well keep the markets choppy and volatile for the remainder of the year.
However, looking at these markets on a Weekly basis, I'd conclude that inasmuch as the current momentum is clearly still up with a higher swing closing low, and since the VIX is now at a very low close (as shown on the last chart), each of these Indices and Sectors has the potential to continue a rally next week in a measured move similar to its last swing move up in this channel, at minimum, and possibly more. In this regard, the minimum potential upside CLOSING targets for next Friday are as follows:
Major Indices:
- Dow 30 = 13336
- S&P 500 = 1413
- Dow Transports = 5177
- Nasdaq 100 = 2723
- Russell 200 = 795
- Dow Utilities = 502
- Consumer Discretionary (XLY) = 44.91
- Technology (XLK) = 30.15
- Industrials (XLI) = 36.81
- Materials (XLB) = 35.95
- Energy (XLE) = 72.20
- Consumer Staples (XLP) = 36.32
- Health Care (XLV) = 39.49
- Utilities (XLU) = 38.58
- Financials (XLF) = 15.02
P.S. Since I've referred to the Russell 2000 as the "Canary in the Coal Mine" in recent posts, and, inasmuch as the Russell 2000 is lagging the other Major Indices in strength, it may be worth watching the RUT:RVX (Russell 2000 Volatility Index) ratio chart to see if volatility in the Russell 2000 increases or decreases and to what degree...please see the 10-Year Monthly and Year-to-Date Daily charts below.
Enjoy your weekend and good luck next week!


