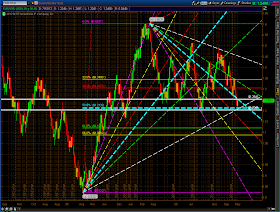
Each candle on the chart below of the EUR/USD forex pair represents 500 pips. The current candle bounced from a Fibonacci and price confluence support level on July 10th of this year at 1.2041 and has rallied 446 pips, so far. Should it continue to advance by a total of 500 pips, it would put price at 1.2541, which is at a confluence of price and Fibonacci resistance.
You can see that this 500 pip level, as depicted by the two white horizontal lines, represents a major level of support and resistance. A break and hold either above or below this "500 pip zone" would set the stage for the next move up or down over the ensuing days/weeks...an important zone to monitor.
P.S. Price target of 1.2541 was hit in 'After Hours' trading on Wednesday, August 22nd...a new 500 pip candle has begun...let's see where EUR/USD goes from here!
