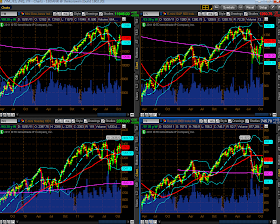
Below are a series of chartgrids of the YM, ES, NQ & TF in a variety of timeframes...very simply, price is trading on the "positive" side of the mid-point of the Bollinger Bands on all timeframes. A cross and hold below could send these e-mini futures back down to their respective lower Bollinger Bands. Otherwise, I'll look for price to rally upwards to their respective upper Bollinger Bands.
Below are Daily charts of Copper, DBC (Commodities ETF), and AUD/USD forex pair. Each one is trading around either their 50 sma (red) or 200 sma (pink)...since these moving averages are also of importance to the YM, ES, NQ & TF at the moment (acting as either support or resistance), I'll also be watching these three for corresponding moves to the equities markets in the days/weeks ahead...for any developing weakness or strength in any of them...and whether volumes build on any further advancement to signal possible institutional commitment, or whether volumes taper off.


