The S&P 500 Index had the biggest Thanksgiving week drop since 1932, according to Bloomberg Businessweek: http://www.businessweek.com/news/2011-11-25/u-s-stocks-cap-worst-thanksgiving-week-drop-since-32-on-europe.html
Further to my post on Wednesday, the VIX closed the week above its triangle apex of 33.80, as shown on the 4-hour chart below...a hold above this level would be extremely bearish for the S&P 500 and could very well send price back down to the October lows.
Below is a chartgrid of the YM, ES, NQ & TF...each candle represents a one-month Options Expiration period. Price on the current candle sits below the middle Bollinger Band on the YM, ES & TF, while it is immediately above on the NQ...whether this candle continues downward for the duration of the current OPEX period remains to be seen...but, at the moment, the momentum has a bearish tilt to it, and price could very well travel to the bottom Bollinger Band at some point before pausing.
Below is a Monthly chartgrid of the YM, ES, NQ & TF. Price on the current candle sits below the middle Bollinger Band on all 4 e-mini futures indices. The same comments apply as noted above.
Below is a Weekly chartgrid of the YM, ES, NQ & TF. Price on the current candle closed below the middle Bollinger Band on all 4 e-mini futures indices. At the moment, the momentum has a bearish tilt to it, and price could very well travel to the bottom Bollinger Band by the end of next week to form a Three Black Crows pattern (which is bearish).
Below is a Daily chartgrid of the YM, ES, NQ & TF. Price broke below the neckline of H&S pattern on all 4 e-mini futures indices...and has fallen below its price target on the NQ and below near-term support...whether it snaps back remains to be seen. At the moment, the momentum has a bearish tilt to it, and price could very well travel to the respective H&S targets on the YM, ES & TF before pausing...bringing the NQ down further, as well.
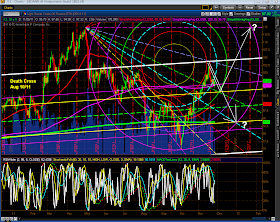
Below is a 4-hour chartgrid of the YM, ES, NQ & TF. Further to my post on Wednesday, I would note that the 50 sma (red) has, once again, crossed below the 200 sma (pink) on the YM to re-form a Death Cross (which had already been re-formed on the other 3 e-minis)...this is a confirmation of the bearish downtrend that began in July of this year...whether or not price returns to retest the 50 sma before resuming its downward trek remains to be seen. A helpful gauge of direction will be a close observation of the VIX.
The US $ is poised to make a run for regression channel confluence at 81.00, as shown on the Daily chart below. If price can break and hold above 80.00, it has a good chance of reaching that target.
Below is a Weekly chart of the EUR/USD forex pair. Price has fallen below a (blue) diamond apex and looks poised to fall to its lower edge where there is confluence with the -1 deviation level of a downward-sloping regression channel at 1.3000.
With respect to the EUR/USD, I'll be watching the European Financials ETF, EUFN, for confirmation of continued weakness, or otherwise. Below is a Daily chart of the EUFN. Price is set to break below its all-time low of 13.64. There was a large volume spike on yesterday's candle, which indicates a much larger than normal interest in this ETF...definitely one worth watching.
Below is a Weekly chart of the Financials ETF, XLF. Price looks poised to continue its downward momentum to a H&S target of 10.50.
Below is a Weekly chart of the Emerging Markets, ETF, EEM. Price looks poised to drop further to a confluence level around 35.00.
Below is a Daily chart of Oil. Price has been bouncing in between Fibonacci levels and could go either direction next week.
Below is a Daily chart of Gold. Price has also been bouncing in between Fibonacci levels and could go either direction next week.
Below is a Daily chart of the Commodities ETF, DBC. A drop and hold below 26.25 could send price down to a regression channel confluence level of 23.70...this is a chart I'll be watching, along with Gold and Oil, to see who influences who, if at all, over the next days/weeks.
In conclusion, it appears that downward momentum is building in the markets, in general...it would take a very large and concerted effort to stop it at this point. Unless something extremely positive emerges in the news over the weekend, I'm not expecting this decline to abruptly end on Monday/next week...I'll be watching the VIX closely.


