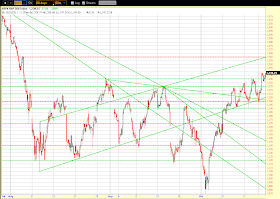
It shows that the $INDU finished the week up at +2%, while the $NDX finished down at -1%. Whether the Technology index is weakening as the leader of the Major Indices remains to be seen in the days and weeks to come...it's a sector that I'll be keeping a close watch on, along with the Financial sector, XLF, which finished the week well ahead of the indices with a gain of around +5.25% on the week. In contrast, the Chinese Financials ETF, GXC, finished the week down at -3.5%.
The Weekly chart below of GXC shows that price was unable to climb above major overhead resistance of 65.00.
The Weekly chart below of Copper also shows that price was unable to continue its climb from prior weeks and closed down on the week just above the 200 sma (pink) and at the Monthly Volume Profile POC.
If the Technology sector, the Chinese Financial sector, and Copper continue to lag and weaken against the Major Indices and the U.S. Financial sector next week (or weeks), it may forecast the demise of those indices and sector...otherwise, a strengthening of these should confirm any continued advance in those markets.
Of course, the fate of the Major Indices seems to hinge on the decisions from Europe...as can be seen on the Weekly chart below of the EUR/USD, price ended the week with a small gain over last week below major resistance of the 50 sma (red) and 200 sma (pink), and price resistance around 1.4.
Furthermore, if the Major Indices and the Financials sector were to rally next week, it's important that they hold the following price levels (see 60-day 60-minute charts below):
- $INDU = 11700
- $SPX = 1230
- $NDX = 2340 (needs to re-capture this price level as it's holding as resistance)
- $RUT = 710
- XLF = 13.00


