WELCOME

Welcome and thank you for visiting!

The charts, graphs and comments in my Trading Blog represent my technical analysis and observations of a variety of world markets...
* Major World Market Indices * Futures Markets * U.S. Sectors and ETFs * Commodities * U.S. Bonds * Forex

N.B.
* The content in my articles is time-sensitive. Each one shows the date and time (New York ET) that I publish them. By the time you read them, market conditions may be quite different than that which is described in my posts, and upon which my analyses are based at that time.
* My posts are also re-published by several other websites and I have no control as to when their editors do so, or for the accuracy in their editing and reproduction of my content.
* In answer to this often-asked question, please be advised that I do not post articles from other writers on my site.
* From time to time, I will add updated market information and charts to some of my articles, so it's worth checking back here occasionally for the latest analyses.

DISCLAIMER: All the information contained within my posts are my opinions only and none of it may be construed as financial or trading advice...please read my full Disclaimer at this link.

Dots

* If the dots don't connect, gather more dots until they do...or, just follow the $$$...

Ice Skating

Ice Skating

ECONOMIC EVENTS

 UPCOMING (MAJOR) U.S. ECONOMIC EVENTS...

***2025***
* Wed. Jan. 29 @ 2:00 pm ET - FOMC Rate Announcement + Forecasts and @ 2:30 pm ET - Fed Chair Press Conference

*** CLICK HERE for link to Economic Calendars for all upcoming events.

Friday, September 30, 2011

Who won the "pinball game" in the 3rd Quarter of 2011?


I love the pinball machine...the only video arcade machine that I've ever enjoyed playing...maybe the action of drawing back on the pinball pulley and watching it spring forth and whack the ball out and into the action reminds me of the 9:30 a.m. stock market bell...then, it's just me and the machine and the paddles...

Since today marked the end of the third quarter for the markets, I thought I'd put up some charts depicting quarterly and yearly timeframes.

First, however, the 4-hourly chart below of the TF shows the "pinball" action that has occurred in each quarter this year. July was quite a decisive month...one month out of nine where it actually trended...more like plunged in one direction. This was also the case for the YM, ES & NQ.


If you look at the Quarterly chart below of the Russell 2000, you can see how much of  the profits that were made in 2010 and 2011 were blown away in the third quarter...but actually most of it in July...timing is everything, eh! The next major level of support sits around 550.


The Yearly chart below of the Russell 2000 depicts a "dark cloud cover" candle formation so far for 2011...a very bearish pattern...however, with 3 months left in the year, anything can happen. It may be worth noting that the long bottom tail on the 2009 candle has never been retested...perhaps that will happen within the next year or so...we certainly have the present global economic, financial, social, and political climate brewing for that to occur.


Below are a Quarterly chart and a Yearly chart for the Dow 30...similar comments apply to the Dow as mentioned above for the Russell. The next major level of support sits around 10000.


Below are a Quarterly chart and a Yearly chart for the S&P 500...similar comments apply to the S&P as mentioned above for the Russell. The next major level of support sits around 1050.


Below are a Quarterly chart and a Yearly chart for the Nasdaq Composite...similar comments apply to the Nasdaq as mentioned above for the Russell. The next major level of support sits around 2100.


Now, if only a quarter would pay for a game of pinball...

I'm officially "crazy"...(or should I say loonie)...

Yahoo...I'm officially crazy...the USD/CAD reached its IH&S 1.05 target today...see my blog posts on September 22nd: http://strawberryblondesmarketsummary.blogspot.com/2011/09/usdcadcall-me-crazy-part-ii.html     AND   June 16th: http://strawberryblondesmarketsummary.blogspot.com/2011/06/usdcad1015-eh105-ehcall-me-crazy.html


Its next major level of resistance is in the vicinity of 1.10 (a level last seen in September 2009) as shown on the Quarterly chart below.


Just for fun, here is what the Yearly chart looks like so far...with 3/4 of 2011 gone now, the current candle has nearly formed a bullish engulfing to last year's open.

The $1 million question is, "Will the US $ see 1.30-1.35 again?"...which is the next major resistance area on this timeframe.


Just send me some advice...

Wednesday, September 28, 2011

"Island Paradise" is gone...


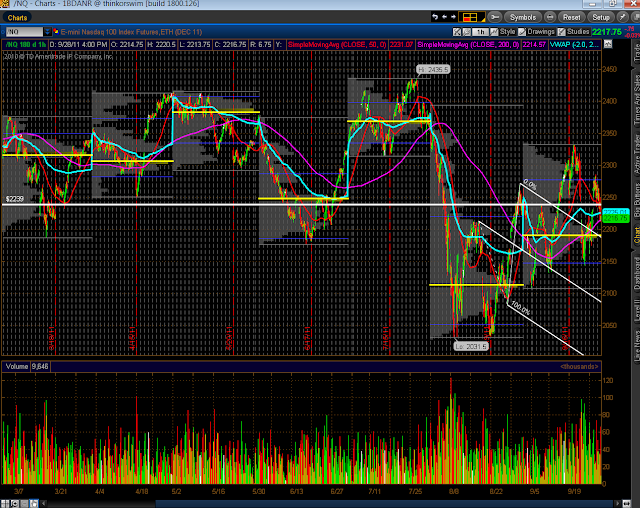
Below are 60 min (trading hours only) charts of the YM, ES, TF & NQ. Overlayed on each chart are:
  • 50 sma (red) and 200 sma (pink)
  • Monthly VWAP (turquoise)
  • Monthly Volume Profiles (the yellow horizontal line is the POC)
  • Andrews' Pitchfork (white)
  • Volumes
My commentary on where price is currently at is provided on each chart as follows.

For the YM:
  • price filled Tuesday's upside gap today on heavy selling volumes which began late yesterday...what was a potential "island bottom" has now been eliminated
  • the 50 sma crossed below the 200 sma last Friday, forming a death cross again...the 200 sma was re-tested Tuesday, Wednesday and today before price closed today immediately below the 50 sma
  • price has re-tested the upper end of the downtrending pitchfork several times and has failed to hold above on all occasions...in fact, it has sold off on high volumes each time consistent with the levels that were made during the various declines which began in May of this year...price is currently just above the "mean"
  • price is trading below the September Monthly VWAP and the September Monthly Volume Profile POC...and ended today at last month's POC and below last month's VWAP
  • price remains weak and is vulnerable to heavy selling below each of the aforementioned studies, and is currently within the one-day range that was established on August 8th (the Monday after the S&P U.S. credit rating downgrade)


For the ES:
  • price filled Tuesday's upside gap today on heavy selling volumes which began late yesterday...what was a potential "island bottom" has now been eliminated
  • the 50 sma crossed below the 200 sma on Monday of this week, forming a death cross again...the 200 sma was re-tested Tuesday, Wednesday and today before price closed today below the 50 sma
  • price has re-tested the upper end of the downtrending pitchfork several times and has failed to hold above on all occasions...in fact, it has sold off on high volumes each time consistent with the levels that were made during the various declines which began in May of this year...price is currently just above the "mean"
  • price is trading below the September Monthly VWAP and the September Monthly Volume Profile POC...and ended today immediately above last month's POC and below last month's VWAP
  • price remains weak and is vulnerable to heavy selling below each of the aforementioned studies, and is currently within the one-day range that was established on August 8th (the Monday after the S&P U.S. credit rating downgrade)


For the TF:
  • price filled Tuesday's upside gap today on heavy selling volumes which began late yesterday...what was a potential "island bottom" has now been eliminated
  • the 50 sma crossed below the 200 sma , forming a death cross again last Friday...the 200 sma was re-tested Tuesday before price closed today below the 50 sma
  • price has re-tested the upper end of the downtrending pitchfork several times and has failed to penetrate and  hold above on all occasions...in fact, it has sold off on high volumes each time consistent with the levels that were made during the various declines which began in May of this year...price is currently below the "mean"
  • price is trading below the September Monthly VWAP and the September Monthly Volume Profile POC...and ended today below last month's POC and VWAP, as well
  • price remains weak and is vulnerable to heavy selling below each of the aforementioned studies, and is currently within the one-day range that was established on August 8th (the Monday after the S&P U.S. credit rating downgrade)...it is the weakest of the four e-mini futures indices


For the NQ:
  • price filled Tuesday's upside gap today on heavy selling volumes which began late yesterday...what was a potential "island bottom" has now been eliminated
  • the 50 sma is still above the 200 sma, but both are in the process of merging with the September Monthly VWAP and are forming a confluence zone 
  • price is currently trading above the downtrending pitchfork...however it has sold off on high volumes after a variety of rallies each time consistent with the levels that were made during the various declines which began in July of this year
  • price is trading below the September Monthly VWAP and above the September Monthly Volume Profile POC...and ended today above last month's POC and VWAP, as well
  • price remains weak and is vulnerable to heavy selling in its current confluence zone, and is currently within the one-day range that was established on August 5th (the day of the S&P U.S. credit rating downgrade)...it is the strongest of the four e-mini futures indices at the moment


While technology is still the "flavour of the day," it is not immune to comparable sell-offs like the one we saw today as shown on the one-day comparison chart below of the Dow 30, S&P 500, Russell 2000, and Nasdaq 100:


So, at the moment, weakness prevails in the YM, ES, TF & NQ.

Tuesday, September 27, 2011

Markets "testing the mettle"...

In previous posts, I referred to the current economic situation facing the average American...namely:
  • the prospect of higher inflation to be brought about by a rise again in equity, oil and commodity prices because of the Fed's decision to hold interest rates low for the next two years, along with the potential for further monetary stimulus by various world governments
  • the slowing in domestic and global economic growth
  • the slowing in consumer spending
  • the continued depression in house sales
  • the continued acceleration of the national debt at enormous rates because of an imbalance in tax and GDP revenues versus government spending and debt repayment obligations
  • the continued high unemployment rate
  • continued cross-border red tape and trade protectionism
  • concerns over Europe's fractured economic, financial, and fiscal policies
Add those to the uncertainty of a federal election facing Americans in 2012, along with a dysfunctional and unco-operative atmosphere surrounding any probable agreement on major bills facing the politicians between now and then, and we get quite an unappealing economic and social smorgasbord from which to pick our appetizers, main course, and dessert. This is the kind of table that Mr. Market has set out for all to peruse.

The market participants have gorged and purged since August 5th, alternating between fear and complacency, with large, volatile intraday swings and gaps...the gaps, most notably, have been around the August 8th level...traders seem to be concerned about the S&P downgrade of the U.S. credit rating that was issued on August 5th, along with the Fed's downgraded economic outlook for the U.S. on August 9th.

It may take more than just the emergence of a financial bail-out package being contemplated in Europe (or even in the U.S. at some future point) to set a proper table from which to feast without fear of the table cloth being violently yanked out from underneath, sending the food flying in the process. The markets, and the public in general, may wish to see a concerted, sincere effort, with decent results, from politicians which actually fix these problems...and soon. In the absence of such a scenario, I would consider any continued bounce in the markets to be undertaken on "borrowed time and highly leveraged money," carrying with it considerable downside risk.

Monday, September 26, 2011

Which way now, Captain?


The markets seem to have lost their way and are trying to find direction as shown on the 4-hour chartgrid below of the YM, ES, NQ & TF. They're stuck in an "orbit" around their trading range from August. Any attempts to break below have, so far, been thwarted...and the same on attempts to break out on the long side. It would appear that a major catalyst may be needed to move them one way or the other with conviction and on high volumes...and, no doubt, that would be some kind of major news event.


Further to my post last Tuesday, Copper pierced its H&S target of 3.15 in pre-market trading today and ended on a very long-tailed "hammer" just above a support level of 3.3 as shown on the Daily chart below. The health of "Dr. Copper" from here may help to determine the next direction of the equities markets. At the moment, it is much weaker than the equity markets, which may be a precursor of what is to come in those markets.


Further to my post last Thursday on the USD/CAD, attempts to push the US $ further up versus the Canadian $ have failed as shown on the Daily chart below. We'll see whether money begins to flow out of the US $ in any kind of meaningful way in spite of what the Golden Cross is signalling, or whether price simply consolidates before the buying resumes to its ultimate IH&S target of 1.05, and, as an inverse relationship, whether selling resumes in the equities markets.

Sunday, September 25, 2011

In the midst of stormy weather...


At the end of the gloomy atmosphere engulfing global economies and their stock markets awaits a rainbow...


...but, first, the storm needs to vent its fury and break before the air is cleared...in the meantime, we're soggily weathering and awaiting that event...

Friday, September 23, 2011

Bears waiting...


The most interesting thing I could find to write about after today's and yesterday's whippy intraday range-bound action was the decidedly bearish finish to the week (on high volume) on the YM, ES, NQ & TF as shown on the Weekly chartgrid below.

They seem to be pointing the way down to the -2 deviation level of the uptrending regression channel, which began at the March 2009 lows, and is roughly in the vicinity of the 50% Fibonacci retracement levels from those lows to the highs reached this year. These confluence zones are sitting around 10000 on the YM, 1050 on the ES, 1800 on the NQ, and 600 on the TF (although I wouldn't be surprised to see the TF fall to around 550).

We'll see whether the bearish momentum continues next week, or whether a small bounce occurs first.

Thursday, September 22, 2011

USD/CAD...call me crazy, Part II

On June 16th of this year, I posted possible upside targets for the USD/CAD of 1.015 and 1.05:  http://strawberryblondesmarketsummary.blogspot.com/2011/06/usdcad1015-eh105-ehcall-me-crazy.html

Since that time, price bounced around and eventually formed a larger upward-sloping IH&S pattern. The falling 200 sma (pink) held as resistance, as shown on the Daily chart below, until it broke above on August 8th, where it based until a further break and close occurred above the 1.00 (parity) level yesterday. Today marked three noteworthy events:
  • a close above the 1.015 level,
  • a breakout and close above the IH&S neckline, and
  • a Golden Cross of the 50 sma (red) above the 200 sma (pink)

Yesterday's and today's actions are important, in my view, because of the breakout of the August trading range that it was in since the infamous U.S. credit rating downgrade, today's Golden Cross event, and because of the reclaiming of parity by the U.S. $ with the Canadian $.

Price may pull back for a re-test of 1.015 (or even 1.00) before resuming a bounce to, ultimately, what turns out to be an IH&S target of 1.05.


This chart will be worthy of my attention, in addition to Copper (which I wrote about on Tuesday of this week), as a possible confirming indicator of what the equities markets may do over the ensuing days/weeks (e.g. strong U.S. $ vs. weak Copper and equity markets).

Fibonacci Confluence Zones on Major Indices

Further to my last post, I would offer the Daily chartgrid below of the Dow 30, S&P 500, Nasdaq Composite, and Russell 2000. Overlayed on each chart are two Fibonacci fan line drawings and an external Fibonacci retracement drawing. The downtrending fan lines begin at the highs of 2007, the uptrending fan lines begin at the 2009 lows, and the external retracement begins at this year's August lows. The support level targets to which I referred yesterday are also shown...these levels are in the vicinity of intersecting Fibonacci confluence levels.

At the time of writing this post, price has fallen below the 50% level of the August range, but is still contained within...we'll see how it closes the day and where price eventually ends up over the next days and weeks to come.

Wednesday, September 21, 2011

The first day of Fall arrived like a lion with the smell of the US $ in the air...


After the Fed delivered its report today, money flowed out of equities, ETFs, commodities, foreign ETFs, and foreign currencies and into the US $. Hit particularly hard were Foreign ETFs, emerging markets, industrials, metals & mining, energy, financials, and the small caps sector as shown on the grids below.


The "thumbnail" view of the intraday comparison chart below of the Major Indices shows where price stopped falling by the end of the day...each at their respective near-term support levels and above their August lows.


Based on:
  • the Fed's new statement today of significant downside risks to the economic outlook, including strains in global financial markets,
  • fiscal challenges and political fractures that continue to plague Europe and the U.S.,
  • inflation still above the Fed's comfort zone,
  • and today's U.S. bank downgrades by Moody's (Bank of America, Citigroup and Wells Fargo), 
I would rate today's drop as a signal that the bottom of the decline in equities that began in May of this year has not yet been reached.

In that regard, I would re-iterate that the next support levels are around 10000 on the Dow 30, 1050 on the S&P 500, 1700 on the Nasdaq 100, 2100 on the Nasdaq Composite, and 550 on the Russell 2000 and could be reached sometime this year, as discussed in my post on September 12:  http://strawberryblondesmarketsummary.blogspot.com/2011/09/money-is-always-interesting-subject.html

I will hold that view until the above challenges have been resolved. I am not a skeptic, but am a student of skepticism, optimism and probabilities...in this case, I do not see a case for an optimistic outlook for the equity markets for the foreseeable future.

TF swirling around confluence...

Below are two 4-hour charts of the TF. The first shows a larger picture with a Fibonacci retracement and 2 regression channels overlayed on it.


The second is a closer look at this chart...at the moment price is just beneath a merging confluence of :
  • uptrend line (which began at the August low and which has been broken for the third time with today's action)
  • the "mean" of the longer-term downtrending regression channel, as well as the "mean" of the shorter-term uptrending channel
  • 50 sma (red) & 200 sma (pink)
  • Monthly VWAP (broken blue line)
  • Monthly Volume Profile POC (horizontal dotted pink line at the right edge of the chart)
As well, price has been unable, so far, to remain above the lower one-third of the Fib retracement level and has retraced to just above the 38.2% level on one occasion.

Price action so far today has been indecisive as evidenced by the last two high wave spinning tops...hardly surprising pending the outcome of the Fed meeting today.


The last chart is a 60 minute (market hours only) comparison chart of the Russell 2000 with the Nasdaq 100, the Dow 30 and the S&P 500. With such a large spread between the Russell and the Nasdaq (with the Dow & S&P caught in the middle), it will be interesting to see which of these two accelerates or decelerates the most to potentially catch up with movement either up or down in due course.

Tuesday, September 20, 2011

"Copper" for your thoughts?

Among many other uses, copper is useful for the two things in life that are a certainty...paying one's taxes and funeral costs...although it will take a lot of pennies to to that.

The chart below depicts a 3 days/candle timeframe on Copper. The current candle began today. Overlayed on the chart are 2 regression channels. Last Thursday, price broke below near-term support of 3.8785 and continued to fall into the end of today's trading. Price is currently sitting below the -1 deviation levels of both channels and is in between the 50 sma (red) and 200 sma (pink). The next support level is just below at 3.666...with major support below at 3.53 where there is a confluence of:
  • price support,
  • the rising 200 sma,
  • the -2 deviation level of the shorter downtrending regression channel,
  • and the neckline of the former Head & Shoulders pattern that was broken in July 2008 which began the plunge to the lows in December of that year where price firmed before the Major Indices did in March of 2009.


Since this commodity has broken below the August support level and is displaying relative weakness to the Major Indices (Dow 30, S&P 500, Nasdaq 100, and Russell 2000), it will be interesting to see whether it continues to drop after the Fed meeting report comes out tomorrow and over the next days and weeks to come, and whether the Major Indices will follow.

The permanent wave?...Who will be shocked straight?


It seems as though the markets are stuck in a permanent wave formation...the action since last Friday has seen resistance hold at the August 5th highs on the YM & ES...the NQ has surpassed that level...while the TF hasn't reached it yet as shown on the 60 min (market hours only) chartgrid below. It looks as though they are awaiting word from the Fed to either confirm the bearish mood that was present during the hours leading up to Standard & Poor's announced U.S. credit rating downgrade, or reverse that mood to spur a buying frenzy.


Note on the following two 60 min comparison charts that the spread between the NDX & RUT is widening...how long will this be sustainable before one or the other reverses sentiment to close the spread?


Monday, September 19, 2011

An AAPL a day...


"Moon shots" of AAPL...it just keeps following its uptrending regression channel "mean" on the Monthly chart...


...approaching resistance at 420.00ish (+2 deviation level of the uptrending regression channel on the Weekly chart)...


...approaching resistance at 420.00ish (+1 deviation level of the uptrending regression channel on the Daily chart)...note that my RSI indicator is running hot...


...approaching resistance at 420.00ish (+1 deviation level of the uptrending regression channel on the 4-Hour chart--market hours only)...note that my RSI indicator is running hot...


...hit resistance today at +2 deviation of the uptrending regression channel on the 1-hour chart (market hours only) on high volumes (note that the channel begins at the low of August 8th...the day after Standard & Poor's U.S. credit rating downgrade)...


On these particular charts, near-term resistance lies between today's high of 413.23 and the regression channel confluence zone of 420.00ish, with near-term support at 400.00ish (regression channel "mean" confluence zone on all timeframes, except the 1-Hour which is currently at 390.00ish). We'll see what the Doctor orders over the next few days..."rest & relaxation" or "more uphill exercise."