Pages

Saturday, July 30, 2011

GS, C, XLF & JPM treading water...

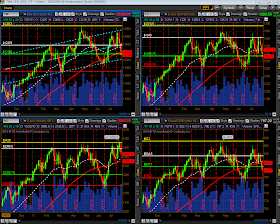
As can be seen on the Weekly chartgrid of GS, C, XLF & JPM below, these financial stocks and ETF have lagged the rally enjoyed by the overall equities markets and have basically remained at their 2009 levels...although XLF tried briefly in 2010 and 2011 to break above and move higher, but failed only to fall back into the upper range of the 2009 levels.

Overlayed on these charts is an uptrending regression channel. Price is consolidating around the -1 deviation level of this channel. A sustained fall below this level could send price back down to the -2 deviation levels.


A downtrending regression channel is also overlayed on the 4-hour chartgrid of GS, C, XLF & JPM below. Price has been attempting to form a level of support around the "mean" while bouncing in between the +1 and -1 deviation levels and essentially chopping sideways in a volatile, wide channel at their 6-7 month lows. At the moment, the "mean" represents an important support level in preventing a return to the -1 deviation level below. These levels are:
GS = 129.00
C = 38.00
XLF = 14.75
JPM = 40.00

I would re-iterate the comments from my June 25 post which stated that, in my opinion, a meaningful reversal of the equity markets to the upside would need the Financials on board, as well.


As an update to my post on July 27, I would mention that the 100sma has now crossed below the 200sma on the Daily chart of XLF...a hold below and move lower would make a move higher in the equity markets more difficult.


Can the Financials deliver?...in the short term?...in the long term?...


Friday, July 29, 2011

3-Day Candles on YM, ES, NQ & TF

My post of July 21 refers:  http://strawberryblondesmarketsummary.blogspot.com/2011/07/ym-es-nq-tfimportant-levels-to-secure.html

Here is an updated shot of that chartgrid of the YM, ES, NQ & TF...each candle represents 3 days...the last candle closed today.


As I mentioned in my prior post, the white horizontal lines were important levels to be secured by the bulls if they were to make a convincing argument against price returning to the red horizontal line and forming a possible right shoulder of a rather large H&S formation (thus forming a neckline at the red line) (or to the bottom of the upward sloping channel in the case of the YM). Such a H&S formation is sloppy, however, on the NQ & TF inasmuch as price has already closed above this white line and the ES has pierced it. However, the ES had not yet closed above this line on this timeframe and that was what the levels in my earlier post on June 27 were based on...I had concluded that the ES, therefore, had the highest potential of returning to the neckline and that if that were to occur, the others would, no doubt, follow.

Since July 21, price did not attempt a bullish breakout on the YM, ES & TF and, instead, fell sharply from those levels. The YM and TF came close to their "necklines," while the ES bounced before reaching its "neckline," and the NQ only reversed on this last candle after closing just beneath its April high on the prior candle.

The important support levels to watch on this timeframe remain:
YM = 12000
ES = 1265.75
TF = 778.10
NQ = 2302

A break (with conviction), close, and hold below these levels would be fodder for the bears. We'll see what domestic and international shenanigans next week brings, and whether or not a "3-Black-Crows" candle pattern emerges on the YM, ES & TF on this timeframe by next Wednesday's close.

Thursday, July 28, 2011

YM, ES, NQ & TF slipping...

Below are 4-hour line-charts of YM, ES, NQ & TF with two regression channels overlayed on them...the longer one (uptrending--Channel #1) begins in December 2010 and the shorter one (downtrending--Channel #2) begins in May of this year.

Current facts about price relative to these two channels on this timeframe are as follows:

  • Price on YM & ES is at an important intersection of the -1 deviation level of Channel #1 and the "mean" of Channel #2...in fact, price is just below this intersection in after-hours trading as I write this post.
  • Price on NQ is currently just below the "mean" of Channel #1 and in between the +1 deviation level and the "mean" of Channel #2.
  • Price on TF is currently trading below the -1 deviation of Channel #1 and in between the "mean" and the -1 deviation level of Channel #2.
In terms of relative strength, I'd rate NQ as the leader, followed by YM & ES, and finally TF. Any sustained rally by these e-minis would require the participation of TF, and, conversely, any sustained breakdown would require the participation of NQ. A sustained breakdown below 12240 by YM and below 1300 by ES would endanger a potential advance to new highs for this year in the near-term...as it stands at the moment, these price levels will  need to be re-captured and held. Attempted intraday rallies have failed to hold so far this week, and all, except NQ, have made consecutive lower closes each day.

Wednesday, July 27, 2011

Stocks Above 20-50-200-Day Averages...

My post on July 14 referred to three charts depicting stocks above their 20-50-200-Day averages as they related to the range-bound equity markets:
http://strawberryblondesmarketsummary.blogspot.com/2011/07/on-different-note.html

I would present the following updated Daily charts as they closed today (charts courtesy of Barchart.com):


It will be interesting to see whether the current levels on all three charts remain below today's close...these large drops and low closes today may be signalling either the beginning of major weakness in the equity markets, or a an exhaustion on the bear side and possible bear trap setup. In any event, I'll continue to track these on a daily basis.

Another chart I'll be watching is the NYSE Summation Index Weekly chart below with a slow stochastics overlayed in relation to the SPX Weekly chart. In the past, a bearish crossover of the stochastics has resulted in a decline on the SPX to some degree...just how much meaning this current crossover has is yet to be determined.


The Daily chart below of the NYSE Summation Index shows a close today just below the 50-day moving average and a bearish crossover on the MACD...signalling the potential for further weakness.


On a side note, NKD closed below the important level of 10,000 today...another index I'll be tracking in conjunction with YM, ES, NQ & TF (it is up very slightly in after-hours trading):

A Noteworthy Event...

A noteworthy event in support of a potential bearish equity scenario that I have my eye on is the possible cross of the 100sma below the 200sma (and holding below) on the Daily chart of the Financial sector ETF, XLF.


As I write this during market hours today, price is currently below 15.00...a level that is fairly important for XLF to hold if it is going to participate in any rally...however, as can be seen from the 4-hour chart below, it is firmly entrenched in a downtrending regression channel that began in February of this year:


It will be interesting to see the Financial market's reaction to the Beige Book report that is due out at 2:00p.m. today, as well as their reaction to  any firm deal reached in Washington on the debt ceiling issue.


Tuesday, July 26, 2011

The "Holy Grail" and "Maslow's Hierarchy of Human Needs"

Unless the rules of the logical brain are sprinkled liberally with the ideas of the creative mind whose joint purpose is to seek benefits for ALL of mankind, then each of us might just as well pack up and move on in search of our own "Holy Grail" separate worlds...because the disjointed and unbalanced way things are going in today's world tells me that the search here on Earth will end one day...no one will be left to light the flame, let alone make the wick.


If the "powers that be" want to know where to begin, they can start with the bottom level of "Maslow's Hierarchy of Human Needs"...there are many holes in each level of today's societal pyramid that need to be filled in, especially in the bottom level. Some say that we humans have evolved and made progress over the centuries...unless today's mal-formed pyramid is repaired from the bottom up, we are poised to make bigger mistakes on an even greater scale than other civilizations did in the past because our pyramid is that much bigger and unbalanced...and it will topple on a much grander scale.

Saturday, July 23, 2011

More "Bi-polar" self-talk...

A theoretical dialogue between my left brain (the rational and logical one) and my right brain (the emotional and creative one) whose purpose is to try and figure out (and trade) next week's direction (and beyond) in the equity and e-mini index futures markets:

Right Brain: "So, who can afford to buy the markets here?"

Left Brain: "Who can afford to short-sell the markets here? By my reasoning, the Risk/Reward Ratio favours buying here, albeit for possibly fewer contracts/shares, because as prices and short-selling risk increase, so may broker margin requirements."

Right Brain: "So, is the Fed (with their intervention with QE1 & QE2) responsible for this dilemma that is now likely facing those parties who were not direct recipients/beneficiaries of these remedies? They face the possibility of ever-increasing reductions in net profit as long as the markets continue to rise unabated. This includes me, of course."

Left Brain: "I have no proof that this was the intent of the Fed."

Right Brain: "So, when do I know when it's time to stop buying and think about selling?"

Left Brain: "When the 'risk' element of your minimum 1:2 Risk/Reward Ratio becomes greater than 1 on the timeframe on which you're trading. Your net profit/loss trading log will tell you whether you're on the right track or not...so pay close attention to it as well as to the price action after your entry with respect to the time spent in a trade and how close price comes to your stop/trailing stop before achieving your target."

Right Brain: "And when do I know when to start short-selling?"

Left Brain: "When your Risk/Reward Ratio is a minimum of 1:2 in favour of the short side."

Right Brain: "What do I do when this ratio favours neither?"

Left Brain: "Stop bugging me then and go outside and play!" "Or, drop down to a smaller timeframe than the one you'd normally trade, and try to achieve your ratio there...but be prepared for smaller targets and profits and longer time spent in a trade."

Right Brain: "Let's eat...I'm hungry!"

Make mine a "Mean" "Double-Double"...

Friday's post below was about an intraday "bigger picture" look at where the YM, ES, NQ & TF were trading in relation to two regression channels...the larger uptrending regression channel begins from last December and the smaller downtrending channel begins from May of this year.

The following updated 4-hour chartgrid of the YM, ES, NQ & TF shows where price closed on Friday in relation to these channels:
  • YM closed just above the "mean" of the larger channel and in between the +1 and +2 deviation levels of the smaller channel
  • ES closed a little above the "mean" of the larger channel and in between the +1 and +2 deviation levels of the smaller channel
  • NQ closed a little below its +1 deviation level of the larger channel and a little below is +2 deviation level of the smaller channel
  • TF closed a little below the "mean" of the larger channel and just above the +1 deviation of the smaller channel

The next chartgrid of the 4 e-minis depicts a Weekly timeframe which also has two regression channels plotted on each chart. The larger regression channel begins from the October 2007 highs and the smaller channel begins from the March 2009 lows. In the case of the YM & ES, the larger channel is still trending downward, while the NQ & TF larger one has turned up.

The following information describes where price closed on Friday in relation to these channels:
  • YM closed just above the +1 deviation level of the larger channel and just below the "mean" of the smaller channel
  • ES closed a little above the +1 deviation level of the larger channel and just below the "mean" of the smaller channel
  • NQ closed a little below its +1 deviation level of the larger channel and just below the "mean" of the smaller channel
  • TF closed just above the +1 deviation level of the larger channel and just below the "mean" of the smaller channel

In order to resume an updward trek on a Daily timeframe, it will be important for all 4 e-minis to recapture and stay above their respective Weekly "mean" on the smaller regression channel.  That will also entail the recapture of the 4-Hour "mean" on the larger regression channel by the TF, and then a hold above the "mean" of this larger channel by all 4 e-minis.

This is what I'll be looking at next week during market hours as one gauge of strength vs. weakness in these e-minis.

***BTW, even though the NQ is outperforming the other e-minis on the 4-Hour timeframe (and the TF is the weakest) (using these channels as a measurement of relative strength/weakness), it is actually very slightly underperforming the TF in relation to where it is within the larger channel on the Weekly timeframe (notwithstanding the fact that it made and closed at an all-time new high on Friday)...and the TF & NQ are both outperforming the YM & ES in relation to this larger Weekly channel inasmuch as they've made new all-time highs and their channels are now uptrending. The TF is one to keep a close eye on...a wolf in sheep's clothing perhaps?

The U.S. is not "On Sale"...

Who's buying (and holding) at these lofty prices?
Will the fish bite here?
Where are the bargains?
Is there some good news around that I don't know about?
Why were the volumes so low on Friday and yet the NQ still managed to make a new all-time high (and a new all-time closing high)?

I await the markets' answers and Wednesday's Beige Book report...


Will Joan Rivers ever look her age?...

Saying a prayer...

For the families of the many victims of Friday's shooting massacre and the bombing in Norway...you are in my prayers and you have my deepest sympathy on this terrible tragedy...I wish your loved ones a safe passage.

Friday, July 22, 2011

Risk ON or Risk OFF?

Risk ON...


Risk OFF...


Stay COOL...


An Intraday "Bigger Picture" Look at YM, ES, NQ & TF

Just a "bigger picture" look at the 4 e-minis...TF is still below its "mean" of the larger regression channel (from last December) and just below +1 deviation of the smaller falling regression channel from May...YM & ES are just above their larger channel "mean" and NQ is still well above...TF will need to break out of this "expanding triangle zone" one way or the other...it's still the laggard on strength...that puts resistance around 844.00 and support around 837.00 on this 4-Hour chart :

Thursday, July 21, 2011

YM, ES, NQ & TF...important levels to secure...

My post of June 27, 2011 refers:  http://strawberryblondesmarketsummary.blogspot.com/2011/06/ym-es-nq-tf3-day-candles.html

Here is an updated shot of that chartgrid of the YM, ES, NQ & TF...each candle represents 3 days...the last candle closed today.


As I mentioned in my prior post, the white horizontal line represented, at that time, the highest close on the left shoulder of a potential H&S formation for this timeframe for this year and presented possible price targets.

This level was reached by all 4 e-minis two weeks ago. The YM is well above this level, the ES is just above this level in after-hours trading, and the NQ & TF are still above this level in after-hours trading after closing above today.

These will be important levels to secure by the bulls if they are to make a convincing argument against price returning to the red horizontal line and forming a possible right shoulder of a rather large H&S formation (thus, forming a neckline at the red line) (or to the bottom of the upward sloping channel in the case of the YM). Such a H&S formation is sloppy, however, on the NQ & TF inasmuch as price has already closed above this white line and the ES has pierced it. However, the ES has not yet closed above this line on this timeframe (today's close was 1342.75) and that was what the levels in my post were based on...it, therefore, has the highest potential of returning to the neckline...no doubt, if that were to occur, the others would follow.

In any event, I'm skeptical that pure technical parameters must be met anymore since the advent of QE1 and QE2.

"Bi-polar" self-talk...

Once upon a time, two halves of a brain decided to engage in a discussion about the country's debt problems. The left brain was rational and logical and the right brain was emotional and preferred elusive, uncertain information. The discussion went something like this:

Left Brain:  "I propose that we reduce the benefits paid on healthcare and pensions to solve our debt problem."

Right Brain: "Would that work?"

Left Brain: "Sure, it's worked for awhile in the past and now we stand to have an even greater savings because of the ever-increasing growth in the proportionally-large aging population."

Right Brain: "Why not just tax the wealthy?"

Left Brain: "Because that's never been done before, so there's no proof that it would work."

Right Brain: "But that's not very humane...what about all the suffering and hardships that would occur on an increasing basis?"

Left Brain: "That depends on whether or not you look at it from a rich person's viewpoint."

The End

Author--SB


Seeing Double?...YM, ES, NQ & TF...

Am I really seeing double? As I look at the Daily charts of the YM, ES, NQ & TF, I'm noticing something else besides their large sideways trading ranges since the beginning of the year...and that is the attempt to form double cups & handles. The first formation is delineated with the pink numbers, and the second by yellow ones.

Apparently, V-bottom cups don't produce as strong a signal for the handle to break out by 100% of the depth of the cup as the ones whose bottoms are more rounded. The first cup's attempt to form a 100% handle extension failed on the YM after a V-bottom bounce. The second cup's bottom produced a double bottom (and came close to hitting the bottom of the first cup) and bounced off the rising 200sma (pink). A potential handle is forming after a 50% fib retracement and bounced off the flattening/falling 50sma. A 100%  handle breakout from the top of Cup 2 could, theoretically, push price up to around 13600 by the end of August if the rising trendline trajectory plays out. However, volumes on the handle pullback should be lighter than those on the right side of the cup...the volumes on this pullback are heavier and may thwart such an attempt. Also, as I'm writing this during today's intraday action, volumes on this last bounce are lower than the last pullback. It remains to be seen as to how this will play out.


The first cup's attempt to form a 100% handle extension failed on the ES after a V-bottom bounce. The second cup's bottom produced a double bottom (and came close to hitting the bottom of the first cup) and bounced off the rising 200sma (pink). A potential handle is forming after a 60% fib retracement and bounced off the falling 50sma. A 100% handle breakout from the top of Cup 2 could, theoretically, push price up to around 1450 by the end of August if the YM's trajectory plays out and this follows suit. However, volumes on the handle pullback should be lighter than those on the right side of the cup...the volumes on this pullback are heavier and may thwart such an attempt. Also, as I'm writing this, volumes on this last bounce are lower than the last pullback. Additionally, a fib retracement of anything greater than 50% dilutes the chances that this is an actual cup and handle formation. It remains to be seen as to how this will play out.


The first cup's attempt to form a 100% handle extension failed on the NQ after a V-bottom bounce. The second cup's bottom produced an inverted H&S formation (and re-tested the bottom of the first cup) and bounced just beneath the rising 200sma (pink). A potential handle is forming after a 40-50% fib retracement and bounced off the flattening/falling 50sma. A 100% handle breakout from the top of Cup 2 could, theoretically, push price up to around 2650 by the end of August if the YM's trajectory plays out and this follows suit. However, volumes on the handle pullback should be lighter than those on the right side of the cup...the volumes on this pullback are heavier and may thwart such an attempt. Also, as I'm writing this, volumes on this last bounce are lower than the last pullback. It remains to be seen as to how this will play out.


The first cup's attempt to form a 100% handle extension failed on the TF after a V-bottom bounce. The second cup's bottom produced an inverted H&S formation (and re-tested the bottom of the first cup) and bounced off the rising 200sma (pink). A potential handle is forming after a 50-60% fib retracement and bounced off the falling 50sma. A 100% handle breakout from the top of Cup 2 could, theoretically, push price up to around 940 by the end of August if the YM's trajectory plays out and this follows suit. However, volumes on the handle pullback should be lighter than those on the right side of the cup...the volumes on this pullback are heavier and may thwart such an attempt. Also, as I'm writing this, volumes on this last bounce are lower than the last pullback. Additionally, a fib retracement of anything greater than 50% dilutes the chances that this is an actual cup and handle formation. It remains to be seen as to how this will play out.


In any event, the intraday swings continue to be large, sharp and unwieldy as this unconfirmed formation attempts to be built by the MM's in their bid to push the markets higher without any additional QE at the moment.

Wednesday, July 20, 2011

How long with this play on Wall Street?...

THE PLAYERS (ACT I):

Sprinkler...................................."Joe Average" Technical Trader
Snoopy........................................The Banks
Charlie Brown...........................The Fed with QE1


THE PLAYERS (ACT II):

Sprinkler...................................."Joe Average" Technical Trader
Snoopy........................................The Banks
Charlie Brown...........................The Fed with QE2


To be continued...

The Markets & Elvis...

To sum it up, the markets so far this year are simply gyrating like Elvis' hips:


From the Daily chartgrid of YM, ES, NQ & TF above, you can see that:
  •  all 4 are trading above their Bollinger Band mid-point (with the YM & NQ higher than the ES & TF),
  • all 4 are still above their 50sma,
  • the YM & NQ are above their 38.2% Fibonacci retracement level of this year's trading range,
  • and the ES & TF are in between their 38.2 & 50% Fib retracement levels of this range.
My post of July 12 referred to this chartgrid: http://strawberryblondesmarketsummary.blogspot.com/2011/07/some-statistics-for-ym-es-nq-tf.html
Since then, price is relatively unchanged after retesting the low and the high of that day's price action. I would re-iterate that we would need to see volume evidence on the Daily timeframe that sustained buying is happening and not the large intraday swings that are still occurring in both directions...otherwise, we will likely see further drifting within this range until a catalyst comes into play that moves the markets one way or the other and outside of the range.


"Some people tap their feet, some people snap their fingers, and some people sway back and forth. I just sorta do 'em all together, I guess."
--Elvis in 1956, talking about his way of moving on stage

By the way, there will always be a debt crisis in countries around the world until their debt starts to (and continues to) decrease...it won't  be "solved" by delaying "paying the piper."

Rules and Red Tape

When I worked as a city planner in my former "life-before-trading" profession, I used to play softball with my female and male co-workers after work once a week during the warmer months of the year and then we'd gather at the pub for a laugh. At first, there were only two teams and no rules...they would give me a chance and let me swing until I hit the ball. I was a crappy ball player, but my team didn't seem to care, and it was fun. Over the years, our little group grew into a "beer league" consisting of 12 teams...rules came into play after the addition of the third team and they grew exponentially thereafter each year. The game got serious and it was no longer fun. So I eventually stopped playing...I missed the camaraderie that we used to enjoy, but not the stress and hassle of all the seriousness and formalization that resulted from the growth of our once-cozy little group. Others who were also part of our original group dropped out along the way for the same reasons.

It seems that with the growth of any entity comes the establishment and growth of rules, as well. This phenomenon certainly applies to countries and their protectionist rules and red tape that have been implemented over the years in relation to trade between countries. As economic conditions falter and growth slows in countries, some rules get re-written and other new rules get added. This, of course, causes delays in the clearance of products across borders and costs money to the affected companies. Since these costs affect a company's bottom line, they end up being passed on to consumers.

At some point, consumers become vigilant in their budget and spending priorities. Today, the retail sales report showed a slowdown in year-on-year sales from 5.4% to 3.8%. Perhaps the growing costs of cross-border red tape is reflected in and partly responsible for the slowdown in retail spending. This would, of course, add pressure to the woes of the slowing economic growth, higher unemployment, as well as higher inflation currently surfacing in the United States. As a result, it appears as though a reduction in consumer spending would not necessarily equate with a reduction in the price of goods (or services) unless cross-border rules/restrictions and red tape are sufficiently relaxed.

It remains to be seen as to whether or not such a measure would actually materialize at some point, or whether taxes and interest rates will be raised to cover the shortfall on GDP revenues. Personally, I don't see this happening...only higher costs and higher taxes...so I doubt whether my theory would ever be tested.


Monday, July 18, 2011

Near-term Support & Resistance...YM, ES, NQ & TF

Below is a 4-hour chartgrid of YM, ES, NQ & TF with 2 regression channels...the longer one begins around the end of November 2010 for YM, around the end of October 2010 for ES, around mid-November 2010 for NQ, and around the end of October 2010 for TF...the shorter one begins around the beginning of May 2011 for all four.

As things stand at the moment and relative to their current levels within these channels, I'd put near-term resistance around:
YM = 12375...then 12500
ES = 1321...then 1333
NQ = 2353...then 2400
TF = 825...then 838.50

I'd put near-term support around:
YM = 12150...then 12030
ES = 1293...then 1281
NQ = 2331...then 2285
TF = 808...then 795


As can be seen, price is currently trading:
YM = just below the level at which both channels' "means" intersect (at 12375ish)
ES = approximately 20 points below this intersection (of 1321ish)
NQ = just above this intersection (of 2331ish)
TF = approximately 9 points below this intersection (of 825ish)

At the moment, the NQ is showing greater relative strength, followed by the YM, ES & TF with respect to their position within these regression channels. Any breakdown of the YM, ES & TF below current levels would require the participation of the NQ.

I wonder if these horses felt as tired as I feel at the end of a trading day...