My post of July 21 refers: http://strawberryblondesmarketsummary.blogspot.com/2011/07/ym-es-nq-tfimportant-levels-to-secure.html
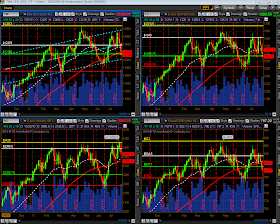
Here is an updated shot of that chartgrid of the YM, ES, NQ & TF...each candle represents 3 days...the last candle closed today.
As I mentioned in my prior post, the white horizontal lines were important levels to be secured by the bulls if they were to make a convincing argument against price returning to the red horizontal line and forming a possible right shoulder of a rather large H&S formation (thus forming a neckline at the red line) (or to the bottom of the upward sloping channel in the case of the YM). Such a H&S formation is sloppy, however, on the NQ & TF inasmuch as price has already closed above this white line and the ES has pierced it. However, the ES had not yet closed above this line on this timeframe and that was what the levels in my earlier post on June 27 were based on...I had concluded that the ES, therefore, had the highest potential of returning to the neckline and that if that were to occur, the others would, no doubt, follow.
Since July 21, price did not attempt a bullish breakout on the YM, ES & TF and, instead, fell sharply from those levels. The YM and TF came close to their "necklines," while the ES bounced before reaching its "neckline," and the NQ only reversed on this last candle after closing just beneath its April high on the prior candle.
The important support levels to watch on this timeframe remain:
YM = 12000
ES = 1265.75
TF = 778.10
NQ = 2302
A break (with conviction), close, and hold below these levels would be fodder for the bears. We'll see what domestic and international shenanigans next week brings, and whether or not a "3-Black-Crows" candle pattern emerges on the YM, ES & TF on this timeframe by next Wednesday's close.

