As can be seen on the 4-hourly chart grid below, YM, ES, NQ & TF are flirting with their respective levels of support that have been formed over the past days or weeks:
The chart grid below shows Daily candles on ZF, ZN & ZB, which are in the vicinity of prior resistance levels...as well as FVX, TNX & TYX, which are in the vicinity of prior support levels:
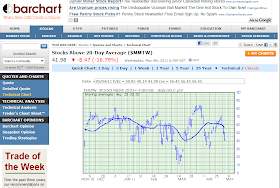
Below is a chart showing Stocks Above 20-Day Moving Average (this chart and the next two are courtesy of http://www.barchart.com/):
Below is a chart showing Stocks Above 50-Day Moving Average:
Below is a chart showing Stocks Above 200-Day Moving Average:
As can be seen on the three charts above, each one is in the vicinity of prior support.
It is my view that any further significant decline on YM, ES, NQ & TF would need to penetrate and hold beneath recent support levels on sufficient volumes and momentum, along with the continued advancement of the bond markets, in order to signal a possible reversal of their daily uptrends in the making. As usual, I'll be viewing intraday price and volume action around their Daily Pivot Point levels, as well as other market internals, to determine direction on a daytrading basis.
In addition, I will be keeping an eye on NKD (see chart below) which did fill its post-earthquake gap-down @ 10,005 but did not close above and has fallen back to the 9800 level...as well, the 50sma (red) has X'd below the 200sma (pink) on the Daily chart...price has been struggling between 9400 & 9800 for quite a few weeks now:


